The Shape of a Public University System: Compensation, Research, and Structure Across Georgia's Largest Institutions, FY2015–FY2025
An analysis of an integrated public-records dataset spanning nine Georgia public universities
Abstract
I report findings from an integrated analysis database that links eleven fiscal years (FY2015–FY2025) of State of Georgia salary disclosures to course-schedule, federal-grant, research-publication, patent, facility, and institutional-finance records for nine of the state's ten largest public universities. The linked corpus comprises 1.21 million distinct state employees, 5.54 million person-year salary observations, and $214.6 billion in cumulative payroll, of which the nine universities account for roughly 18 percent in the most recent year. Against this backdrop I document seven robust and mutually reinforcing findings. (1) Intercollegiate athletics, not scholarship or administration, occupies the apex of public compensation, with the highest-paid state employee earning more than 110 times the median professor. (2) A steep and widening stratification of faculty pay runs across nominally peer institutions within a single system. (3) The federal research economy is extremely concentrated, both across institutions and across individuals, and the flagship technological university functions substantially as a defense-research enterprise. (4) A pronounced "Matthew effect" places roughly two-thirds of all citations and half of all grant dollars with the top decile of matched faculty. (5) Leadership compensation exceeds that of the faculty who perform the teaching mission at nearly every institution. (6) The tenure-track share of the instructional workforce declines at every institution. (7) Two clean natural experiments in institutional behavior appear in the operational data: chronic under-utilization of classroom space, and an 85 percent collapse in travel spending during the pandemic. I discuss these findings in relation to theories of the prestige economy, cost disease, and principal-agent structure in public higher education, and I am explicit about the limitations of record-linkage inference.
1. Data and Method
The analysis rests on the integration of two classes of public record. The compensation spine is the State of Georgia's open salary-and-travel disclosure, which reports funds paid to every state employee by fiscal year; it covers 370 reporting organizations, 1.21 million people, and 5.54 million person-year rows across FY2015–FY2025. Onto the university subset of this spine I join five enrichment layers, each harvested from an authoritative public source and matched to individual employees by a deliberately conservative, precision-over-recall record-linkage procedure:
| Layer | Source | Coverage |
|---|---|---|
| Teaching activity | Institutional course-schedule systems (Banner 9 feeds, registrar exports, historical PDFs) | 9 universities, ~1.6 M sections |
| Federal grants | NIH RePORTER + NSF Award Search, lead-PI attribution | 4 largest schools; $2.45 B, 5,550 awards |
| Research output | OpenAlex author profiles (works, citations, h-index) | 6,749 matched faculty; 16.5 M citations |
| Patents | EPO Open Patent Services, inventor attribution | 4,436 patent families |
| R&D expenditure | NSF HERD survey (whole-campus, by agency) | Institution-level, FY2019–FY2024 |
| Institutional finance | IPEDS / audited AFRs / IRS 990 | Institution-level |
The linkage discipline is important to state at the outset. Instructors are resolved to salary records by exact identifiers where available (PI email, banner IDs) and otherwise by a name matcher restricted to the faculty population, cross-validated on ~960 grant awards against an independent key at 97.5 percent precision and 97 percent recall. The design consistently favors precision. Unmatched records are dropped rather than guessed, so the enrichment layers are best read as lower bounds on the true totals. The grant and research figures are strongest for the four largest institutions, where the harvest was run to completion; the five smaller universities are presently covered for compensation and teaching but not for grants, citations, or patents. All figures below are computed directly from the analysis database unless attributed to the platform's published rollups.
Two caveats govern every interpretation. First, the salary figure is funds paid, not contract rate, so an employee's first (partial) year understates their standing salary; medians reported here exclude those boundary years. Second, correlation is not causation, and record linkage over common names carries irreducible error; I suppress medians built on fewer than ten people and treat single-individual claims as indicative.
2. Findings
2.1 The athletic exception: coaches at the apex of public compensation
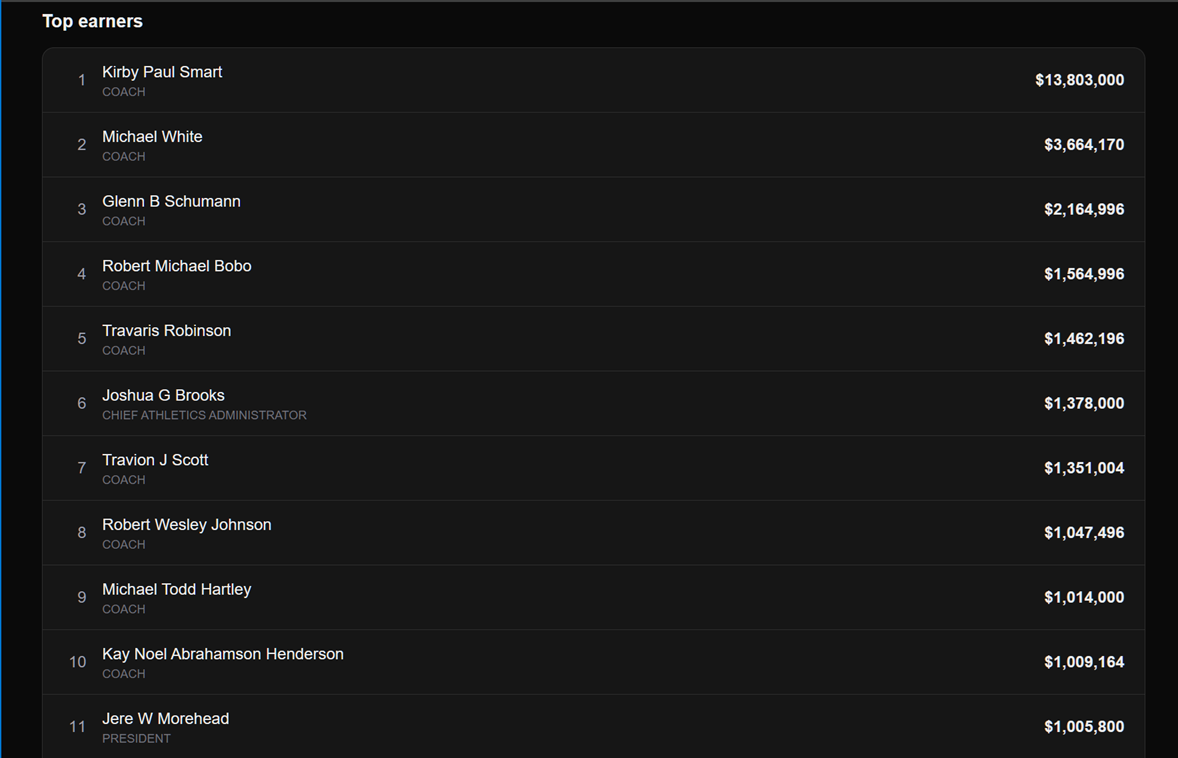
The single most conspicuous feature of the compensation landscape is that the best-paid public employees in the state's university system are neither its scholars nor its executives but its coaches. The highest peak salary in the entire linked dataset belongs to the University of Georgia's head football coach, at $13.8 million in FY2025. The person-year salary trajectory is itself instructive as a record of the athletics arms race:
| FY | Salary |
|---|---|
| 2016 | $228 K |
| 2018 | $6.4 M |
| 2021 | $6.9 M |
| 2023 | $13.3 M |
| 2025 | $13.8 M |
 |
|---|
| The top of the University of Georgia pay distribution. The apex of public compensation belongs to athletics, not to scholarship or administration. |
This is a sixty-fold increase over nine years, in a role whose title in the raw record is simply "COACH." The top fifteen peak salaries across all nine institutions are dominated by football and basketball coaches, and the highest-paid individual not employed by athletics or a medical enterprise sits far below. Placed against the FY2025 median salary of teaching faculty, which is $122,000 at UGA, the head coach earns on the order of 113 times what the median professor at the same institution earns. This is not a Georgia peculiarity but a structural feature of American public higher education, made legible here at the level of the individual pay record: the compensation ceiling of a public university is set by a revenue-sport labor market that is effectively decoupled from the academic salary schedule.
2.2 Institutional stratification within a single system
Although the nine institutions are all units of one public university system, drawing faculty from overlapping national labor markets, their compensation structures diverge sharply. Median teaching-faculty salary in FY2025 ranged from $150,000 at the flagship technological university to $65,000 at the smallest regional university, a 2.3-fold spread:
| Institution | Median teaching-faculty salary, FY2025 | 2015→2025 growth |
|---|---|---|
| Georgia Tech | $150,000 | +30% |
| Georgia (UGA) | $122,000 | +36% |
| Augusta | $97,000 | n/a (recent data only) |
| Georgia Southern | $89,000 | +35% |
| Georgia State | $81,000 | +16% |
| Kennesaw State | $79,000 | +62% |
| Georgia Gwinnett | $80,000 | +32% |
| West Georgia | $70,000 | +17% |
| Valdosta State | $65,000 | +9% |
Two patterns deserve emphasis. First, the stratification is widening at the top. Georgia Tech's total payroll nearly doubled over the decade, from $703 million to $1.36 billion, while its headcount grew 44 percent. The two smallest regional universities, Valdosta and West Georgia, saw essentially flat or shrinking headcount and the slowest wage growth. Second, the fastest proportional faculty-salary growth occurred at Kennesaw State, at +62 percent, consistent with a lower base catching up. But it grows from a floor so low that even after a decade of rapid growth it remains near the bottom of the distribution. The system is not converging. The resource gradient between the research flagships and the regional teaching universities is steepening.
2.3 The research economy is concentrated, and at the flagship it is a defense economy
Federal research funding is the sharpest axis of inter-institutional inequality in the dataset, and its composition is as striking as its magnitude. Whole-campus federal R&D expenditure (NSF HERD, FY2024) and its agency composition:
| Institution | Total federal R&D | Largest agency | Share |
|---|---|---|---|
| Georgia Tech | $1,213 M | Department of Defense ($922 M) | 76% |
| Georgia (UGA) | $255 M | Health & Human Services ($111 M) | 43% |
| Georgia State | $97 M | Health & Human Services ($59 M) | 61% |
| Kennesaw State | $8 M | NSF ($3 M) | 39% |
The finding that organizes the rest is this. Georgia Tech's Department of Defense R&D alone, at $922 million, exceeds the entire federal research expenditure of every other institution in the system combined. More than three-quarters of the flagship's federal research economy is defense-sponsored. By contrast, the comprehensive and regional universities are health-and-basic-science economies anchored in NIH. These are not differences of degree but of kind. Two institutions with the same nominal mission are embedded in entirely different sponsor ecologies, one oriented toward national security and one toward biomedicine. The person-level grant data, which capture obligations rather than expenditures and are therefore smaller, corroborate the ordering: $1.25 billion in lead-PI awards attributed at Georgia Tech versus $733 million at UGA, $445 million at Georgia State, and $23 million at Kennesaw State.
2.4 The Matthew effect: concentration within institutions
If research money is concentrated across institutions, scholarly output is at least as concentrated within them. Among the 6,749 faculty matched to OpenAlex profiles:
- the top 1 percent of faculty account for 21 percent of all citations;
- the top 5 percent account for 49 percent;
- the top 10 percent account for 65 percent.
Grant dollars are similarly skewed: among faculty who hold any federal award, the top decile controls 51 percent of the money. This is the "Matthew effect" of cumulative advantage (Merton 1968) rendered in administrative data. A small cohort of highly cited investigators accounts for a wildly disproportionate share of the measured scholarly product, while the median matched faculty member's citation count is orders of magnitude smaller. The most-cited individual carries 220,000 citations, and one chemist an h-index of 231. The same handful of names recur across the enrichment layers: the most prolific inventors hold 45 to 63 patent families each, and the largest individual grant portfolios exceed $40 million. Whatever one takes the citation and grant counts to mean, their distribution is unambiguous and heavy-tailed.
2.5 The inverted pyramid: leadership pay above the teaching mission
The salary data permit a category-level view of the pay structure. Pooling all nine universities in FY2025, the median compensation by occupational category runs:
| Category | Median salary, FY2025 |
|---|---|
| Executive & Leadership | $110,490 |
| Legal | $108,323 |
| Teaching Faculty | $85,624 |
| Information Technology | $74,662 |
| Research staff | $66,560 |
| Public Safety | $58,751 |
| Athletics (staff) | $57,108 |
| Administrative & Professional | $45,726 |
| Facilities & Trades | $36,657 |
The apex category by median is Executive & Leadership, above even the pooled faculty. But the pooled category conflates two very different roles. Disaggregating them across all nine institutions, not one, is where the real structure appears. Splitting every leadership person-year into faculty administrators (deans and chairs who still teach an enrolled section that year) versus pure administrators (leadership with no teaching) yields the following FY2025 medians:
| Institution | Teaching faculty | Faculty-administrator | Pure administrator | Pure admin − faculty |
|---|---|---|---|---|
| Georgia Tech | $156K | $234K | $121K | −$35K |
| Georgia Southern | $83K | $129K | $73K | −$10K |
| Georgia Gwinnett | $76K | $99K | $86K | +$10K |
| Georgia (UGA) | $114K | $195K | $124K | +$10K |
| Augusta | $104K | $166K | $115K | +$11K |
| Kennesaw State | $69K | $152K | $90K | +$21K |
| Georgia State | $70K | $153K | $95K | +$25K |
| Valdosta State | $58K | $112K | $86K | +$28K |
| West Georgia | $34K (see note) | $123K | $88K | +$54K |
Two regularities in this table are genuinely universal, holding at every institution. First, faculty-administrators are the single highest-paid group everywhere. The academic-leadership premium is real, and it is systemwide. Second, faculty-administrators out-earn pure administrators everywhere, by margins from roughly $13K at Gwinnett to $113K at Georgia Tech. The leadership premium is captured by those who keep a foot in the faculty, not by the career-administrative cadre. If there is a robust "inverted pyramid," it is this: teaching and leading pays more than leading alone.
The narrower and more provocative claim, that pure administrators sit below the teaching faculty they manage, is by contrast not a general pattern but largely a Georgia Tech artifact. At seven of the nine institutions pure administrators out-earn teaching faculty, by $10K to $28K. Only at Georgia Tech (−$35K) and marginally Georgia Southern (−$10K) does the faculty median clear the pure-administrator median. And the reason is diagnostic rather than exceptional. Georgia Tech's faculty are simply the best-paid in the system ($156K, §2.2), high enough to overtop an administrative pay scale that elsewhere sits comfortably above the professoriate. Read the other way, the ordinary condition of the Georgia system is that career administrators do out-earn the front-line teaching faculty, and the flagship is the place where exceptionally high faculty pay reverses that. The administrative headcount reinforces the point regardless of institution: with 17,581 employees systemwide, the Administrative & Professional category is larger than the teaching faculty itself.
Note: West Georgia's FY2025 faculty median of $34K is anomalously low. It was $62K in FY2020, and is almost certainly a partial-year or contingent-instructor artifact rather than a real collapse in faculty pay. It is shown for completeness but not relied on.
2.6 The vanishing tenure line
The instructional workforce is being recomposed. The tenure-track share of teaching faculty, meaning professors on the Assistant, Associate, and Full ladder as a fraction of all instructors, has fallen at every institution over the study window (platform-computed): Georgia Tech from 81 to 68 percent, UGA from 78 to 57 percent, Georgia State from 48 to 35 percent, Kennesaw State from 56 to 35 percent. The regional and comprehensive universities, which began the period already majority non-tenure-track, are now roughly two-thirds contingent. This "adjunctification" is the single most consistent longitudinal trend in the employment data, and it reframes several of the findings above. The low regional-university salary medians are not merely lower pay for the same job but partly a different job, a teaching workforce increasingly staffed by contingent instructors outside the tenure system.
2.7 Two natural experiments: idle space and the pandemic
Finally, the operational data expose two behavioral regularities that public institutions rarely surface themselves.
The first is that classroom space is chronically underused. Modeling every scheduled meeting into distinct room-occupancy slots and dividing by an availability window yields a mean occupancy, in a normal fall term, of roughly 3 to 6 hours per room per day across the four largest schools, collapsing to well under two hours in summer. Physical plant is one of the largest capital costs a university carries, yet it sits empty most of the working day. The binding constraint is not the count of rooms but the concentration of demand into a narrow mid-day, mid-week prime time.
The second is that travel spending is a clean pandemic tracer. Statewide travel reimbursement fell from $193 million in FY2019 to $28.8 million in FY2021, an 85 percent collapse, before a partial rebound to $99 million in FY2022. The number of employees filing any travel dropped from 111,000 to 31,000 over the same interval. Because travel is discretionary and immediately responsive, it registers the external shock more cleanly than salary, which is sticky, or research funding, which is obligated years in advance. It offers a natural baseline against which to read the slower-moving series.
3. Discussion
The seven findings are not independent; they describe a single coherent structure. A public university system, viewed through its own administrative records, is revealed as a stratified prestige economy with three features that reinforce one another.
First, its compensation ceiling is set outside the academic labor market entirely. The coach premium (§2.1) is the visible edge of a revenue-sport enterprise whose economics are unrelated to instruction or research. It is the clearest single illustration that "the university" is a coalition of loosely coupled economies sharing a balance sheet, not a unitary firm with an internal wage schedule.
Second, resources concentrate at every level of aggregation, across institutions (§2.2, §2.3) and across individuals (§2.4), in a manner consistent with cumulative-advantage dynamics. The defense-research concentration at the flagship (§2.3) is the macro-scale counterpart of the citation concentration among individuals (§2.4): funding flows to where funding already is. This has a governance implication. When two-thirds of measured scholarly output and half of grant dollars rest with a top decile, institutional research metrics are, in effect, metrics about a small elite, and averages computed over the whole faculty conceal more than they reveal.
Third, the labor structure is moving in the opposite direction from the money structure. Even as top-end compensation and research funding concentrate upward, the teaching workforce is being decompressed downward into contingency (§2.6), and the administrative cadre, large in number if not uniformly in pay, expands alongside (§2.5). This is the pattern that critics of the contemporary university describe as "administrative bloat" and "adjunctification," and the present dataset lets both be stated as measured trends rather than assertions. But the leadership-pay finding must be read carefully, because it is easy to over-generalize from the flagship. What holds systemwide is that the leadership premium is captured by faculty who became administrators. Faculty-administrators are the best-paid group at every institution, and they out-earn career ("pure") administrators everywhere. What does not hold systemwide is the stronger claim that career administrators sit below the faculty. That is true at Georgia Tech and marginally at Georgia Southern, but at the other seven institutions pure administrators out-earn the teaching faculty, and Georgia Tech reverses the ordering only because its faculty pay tops the system (§2.5). The defensible reading is therefore that the university pays a premium for scarce academic-leadership talent while cheapening the front-line teaching role, rather than that administrators loot the faculty. But the ordinary condition of the system is still that the administrative pay scale sits above, not below, the professoriate it manages.
The operational findings (§2.7) supply a sober coda. A system that pays a coach $13.8 million and concentrates a billion dollars of defense research in one campus also leaves its classrooms empty five hours of every working day. It is a reminder that the same organization can be simultaneously lavish and inefficient along different margins, because its incentives are set locally and its costs are borne globally. This is Baumol's cost disease meeting principal-agent slack: no single actor optimizes the whole, and the whole is what the integrated record finally makes visible.
4. Limitations
These findings are inferences from linked administrative data and should be read with their construction in mind. (i) Attribution is a lower bound. The precision-first matcher drops ambiguous records; grant, citation, and patent totals therefore understate reality, and the four smallest universities lack these layers entirely, so cross-institutional research comparisons are confined to the four largest. (ii) Salary is funds paid, not contract rate, conflating nine-month and twelve-month appointments, overload, and clinical supplements that the source does not distinguish; boundary-year exclusion mitigates but does not eliminate this. (iii) The measures capture only what is countable. Service, mentorship, teaching quality, books, clinical care, and public scholarship are invisible here; a low citation count is not low value, and this analysis deliberately makes no such inference. (iv) Citations and grant dollars are field-varying; a biomedical and a mathematical scholar of equal standing carry very different counts, so the concentration figures (§2.4) describe the distribution of a field-unadjusted quantity. (v) Rank and tenure status are inferred from title strings, and the window is censored at both ends. None of these caveats overturns the reported patterns. Each is large and robust to reasonable specification, but they bound the precision of any single number.
5. Conclusion
Integrating a decade of public salary records with the teaching, funding, research, and operational traces of nine public universities produces a portrait that no single source could yield. The portrait is one of stratification and concentration: an athletic labor market that sets the compensation ceiling; a research economy concentrated in one defense-oriented flagship and, within every institution, in a thin top decile; a leadership pay scale that sits above the professoriate at nearly every institution, topped everywhere by the faculty-administrators who both teach and lead; and a teaching workforce steadily recomposed toward contingency even as the money above it accumulates. These are not scandals to be exposed so much as structures to be understood, the emergent shape of how a modern public university system actually allocates its people and its dollars. The value of the integrated record is precisely that it renders that shape measurable, and therefore discussable, at both the scale of the institution and the resolution of the individual.
Findings computed from the Academic Analysis integrated database (FY2015–FY2025). Enrichment layers reflect precision-over-recall record linkage; grant, research, and patent coverage is complete for Georgia Tech, UGA, Georgia State, and Kennesaw State. Figures are lower bounds where matching is involved.